Day Trading Profit Estimator
Calculator About Example: Basics Example: Trade Limit Example: Share LimitAbout
This calculator will estimate how much you could possibly earn from your trading activities based on the provided values. It randomly generates stock and earnings per share prices based on the provided ranges and calculates a hypothetical scenario on how much you could possibly make by the end of a given period.
It's important that you provide sensible values for inputs. For example, it is more reasonable to assume earnings between $0.05 - $0.1 per share for a $0.50 stock than between $10 - $15.
You can press the Calculate button multiple times and the results will recalculate by generating new random values from the given ranges.
Interface
Account Size: The starting capital or the amount in your trading account that you plan to use for trading. The calculator assumes that you will trade the entire size of your account either in one go or by taking multiple trades by dividing up your account size into equal parts.
Trading Days: The number of days to simulate and calculate results for. There are approximately 252 trading days in a year, sometimes less, depending on what days holidays fall on. You can input 21 to simulate trades for about one month, 5 for a week's worth of trading, etc. The maximum value for this field is limited to 252 (or one year)
Note that calculating results for 5 days (or one week) and multiplying the result by 52 is not the same as calculating results for 252 days (or one year). Your account is accumulating profit with each day, therefore your end results will be much higher for 252 days than for 5.
Trades / Day Min. and Trades / Day Max.: The minimum and maximum number of trades you plan to trade a day. These values can be the same. The maximum value for these fields is 100. If you provide a very big number for these fields, it can take a while (15 seconds or even more) for the results to appear depending on your computer's power.
Price Min. and Price Max.: The price range between which you plan to buy stocks. These values can be the same. You might want to trade smaller priced stocks (eg between $0.5 and $2) or you might be interested in more expensive stocks (eg between $100 and $300). The calculator will randomly generate a stock price for each trade between these numbers. In a real life scenario you might trade a $6 stock first, then one for $2.48, and next there might be a stock at $4.53 that is on the move. You should provide a realistic range, eg between $1 - $5, $1 - $10, $5 - $20, $100 - $200 etc, as opposed inputting numbers that are very far apart, like $1 - $1000.
Earnings Min. and Earnings Max.: The per share amount you plan to make on a trade. These values can be the same. The minimum earnings value should reflect the amount you plan to make on the Price Min. stock, and the maximum value should reflect the amount you plan to make on the Price Max. stock. This number will be randomly generated between the min-max values but it can be influenced by the Earnings Deviation value.
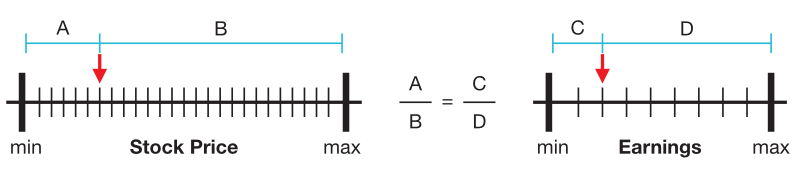
Earnings Deviation: When this value is zero, both the stock and earnings per share values are randomly generated between their respective min-max values. When this value is greater than zero, the earning's ratio to its min-max range will be the same as the stock price's ratio to its min-max range.
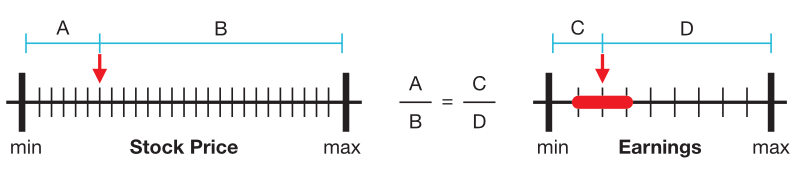
You can control the percentage by which to deviate (±) from the generated earnings price. For example, if an earnings value of $3 was generated and the deviation is set to 1%, the earnings will be randomized between $2.97 - $3.03 ($3 ± 1%). However, if the deviation is set to 20%, the earnings will be randomized between $2.40 - $3.60 ($3 ± 20%). The maximum value for this field is limited to 20%.
Share Limit: This value will limit the number of shares you can purchase. It might not be feasible to assume that you can purchase one million shares (or even half of that) all at once. If the number of purchasable shares (based on your account size and stock price) exceeds this number, the shares will be limited to this value and your purchase price will be adjusted to reflect this change. A value of 0 places no restriction on the number of shares you can purchase. This can lead to unreasonably high outcomes.
Trade Limit: The maximum amount you are willing to spend on a single trade. This value implies that if you plan to make 5 trades per day, each trade will be limited to this amount.
Losers: Percentage of losing trades. The maximum value for this field is limited to 50%. If your losing trades are greater than 50%, you should probably work on your strategy some more.
Fee / Share: Amount you pay for your broker per share. The maximum value for this field is limited to $1.
Results
End Balance: Final balance in your account after all fees (broker fees + FINRA fees).
Gross Profit: Amount of profit before tax. This amount does not include the starting capital.
Tax Rate: The tax rate based on the profit amount.
Tax: Amount of tax to be paid based on the tax rate.
Net Profit: Net profit after tax.
FINRA Fees: Total amount of FINRA fees paid.
Broker Fees: Total amount of broker fees paid.
Total Fees: Total fees paid (broker fees + FINRA fees).
Total Wins: Total amount of winning trades (fees included).
Total Losses: Total amount of losing trades (fees included).
Num. Trades: Number of trades taken for the specified period.
Num. Shares: Number of shares traded during the specified period.
Num. Winners: Number of winning trades for the specified period.
Num. Losers: Number of losing trades for the specified period.
Important
Do not use letters or special characters for input (other than decimal points). Use only numbers or fractions, eg 1, 12, 23.5, 0.005, etc.